
By RIOD Engineering · May 12, 2026
EV Charger Uptime: Online Is Not the Same as Working
A charger that responds to every OCPP heartbeat can still fail every attempted session. Ping-status uptime is the wrong number to steer a network by. NEVI (23 CFR § 680) requires US federally funded stations to report charging-port uptime; in practice, session-success rate is the number we recommend operators track internally because it maps to what drivers actually experience.
Here's how uptime should actually be measured, how NEVI's port-level framing works, and what a real uptime dashboard shows an operator.
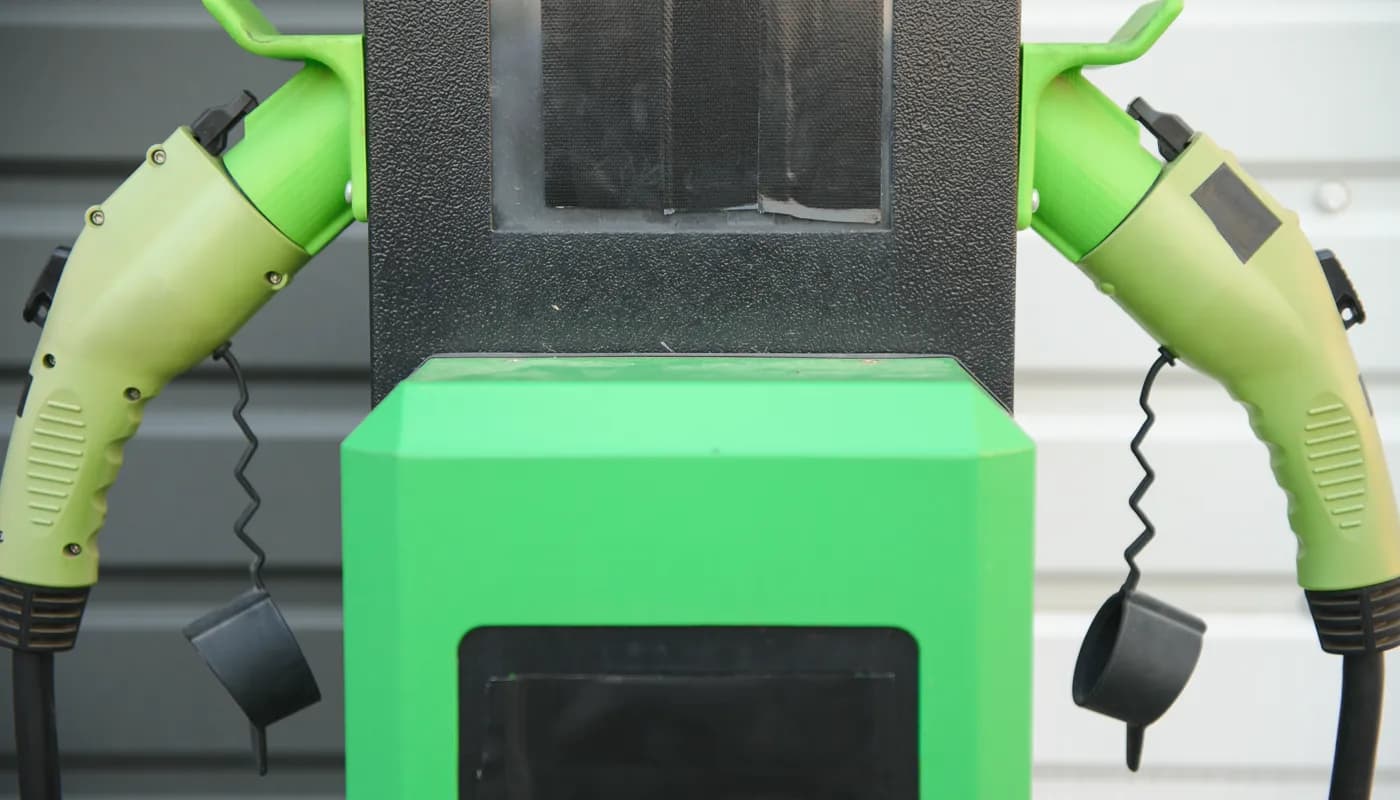
Why ping-status lies
A charger's OCPP heartbeat proves its WebSocket connection is alive. It proves nothing about whether the charger will accept a session, deliver the promised power, or record energy correctly.
In real fleets we see chargers that heartbeat happily while their meter reads zero, their RCD trips instantly on session start, or their relay is welded closed. The CMS's dashboard shows green; the driver's experience is red.
Session-success rate as the real metric
Attempted sessions per charger, per week, per site. Successful sessions where the driver got the energy they expected. Ratio is the uptime.
This aligns with what drivers experience, and with the port-level uptime framing NEVI uses under 23 CFR sec 680. Anything portfolio-only is measuring the wrong thing.
Per-site and per-model reporting
Portfolio-level uptime hides the two chargers dragging your network down. Per-site and per-model rollups surface them. Vendor A models failing at 20% more often than vendor B, that's a procurement signal. Site 7 failing more than the rest, that's a network or civil issue at the site.
Site-host SLAs need the same disaggregation. A mall wanting to know the uptime of the chargers on their property needs the report scoped to that property. A franchise partner wanting to know the same. The reporting engine has to slice cleanly by dimension.
A better uptime formula
- Online uptime: percentage of time the charger is reachable via OCPP
- Charging-port availability: fraction of time the port is ready to accept a session (NEVI's core metric)
- Attempted-session success rate: percentage of driver attempts that deliver energy
- Energy-delivery success: sessions that hit the requested SoC or duration
- Payment-success rate: percentage of paid sessions with clean settlement
Dashboard fields worth tracking
- Attempts started vs successful starts
- Delivered kWh vs requested kWh
- Failed payment starts and their reasons
- Total fault duration per charger per site
- Planned maintenance downtime separated from unplanned
Read Our Next Article
Predictive Maintenance for EV Chargers
Remote EV Charger Diagnostics: Fix Before the Truck Rolls
Payment Migration for EV Charging Networks: What Gets Missed

The Zero-Downtime CMS Migration Playbook
OCPP Profile Drift: Why “OCPP-Compatible” Isn’t Enough for CMS Migration
Enel X Way Shutdown: The Migration Checklist for CPO Fleets
Deploying EV charging?
Talk to our team about your project. We design, supply, and manage EV charging infrastructure across India.